性能测试分析
当你运行 Vitest 时,会显示你的多个时间指标:
bashRUN v2.1.1 /x/vitest/examples/profiling ✓ test/prime-number.test.ts (1) 4517ms ✓ generate prime number 4517ms Test Files 1 passed (1) Tests 1 passed (1) Start at 09:32:53 Duration 4.80s (transform 44ms, setup 0ms, collect 35ms, tests 4.52s, environment 0ms, prepare 81ms) # Time metrics ^^
- Transform :转换文件所用的时间。详见 文件转换。
- Setup :执行
setupFiles配置文件所花的时间。 - Collect :收集测试文件中所有用例的时间,包括导入文件依赖的耗时。
- Tests :实际执行测试用例所用的时间。
- Environment : 配置测试 环境(比如 JSDOM )所需的时间。
- Prepare : Vitest 用于准备测试运行环境的时间。在 Node 环境下,包括导入并执行内部工具;在浏览器中,还包含初始化 iframe 的时间。
Test runner
当测试执行时间较长的时候,可以生成测试运行器的性能分析报告。可以参考 NodeJS 文档来了解和使用这些选项:
WARNING
由于 node:worker_threads 的限制, --prof 不能与 pool: 'threads' 一起使用。
要将这些选项传递给 Vitest ,可以在 Vitest 的配置中定义 poolOptions.<pool>.execArgv:
import { defineConfig } from 'vitest/config'

export default defineConfig({
  test: {
    pool: 'forks',
    poolOptions: {
      forks: {
        execArgv: [
          '--cpu-prof',
          '--cpu-prof-dir=test-runner-profile',
          '--heap-prof',
          '--heap-prof-dir=test-runner-profile'
        ],

        // 生成单一的配置文件
        singleFork: true,
      },
    },
  },
})import { defineConfig } from 'vitest/config'
export default defineConfig({
test: {
pool: 'threads',
poolOptions: {
threads: {
execArgv: [
'--cpu-prof',
'--cpu-prof-dir=test-runner-profile',
'--heap-prof',
'--heap-prof-dir=test-runner-profile'
],
// 生成单一的配置文件
singleThread: true,
},
},
},
})测试运行后,应该会生成 test-runner-profile/*.cpuprofile 和 test-runner-profile/*.heapprofile 文件。想要知道如何分析这些文件,可以仔细查看「 检查分析记录 / Inspecting profiling records 」。
也可以看看性能分析 | 示例。
Main thread
对主线程进行性能分析有助于调试 Vitest 的 Vite 使用情况和 globalSetup 文件。 这也是 Vite 插件运行的地方。
要执行此操作,需要向运行 Vitest 的 Node 进程传递参数。
$ node --cpu-prof --cpu-prof-dir=main-profile ./node_modules/vitest/vitest.mjs --run
#      ^^^^^^^^^^^^^^^^^^^^^^^^^^^^^^^^^^^^^^                                  ^^^^^
#               NodeJS arguments                                           Vitest arguments
测试运行后会生成一个 main-profile/*.cpuprofile 文件。有关如何分析这些文件的说明,可以查看检查分析记录。
File transform
当测试转换和收集的时间较长时,可以使用环境变量 DEBUG=vite-node:* 来查看哪些文件正在被 vite-node 转换和执行。
$ DEBUG=vite-node:* vitest --run

 RUN  v2.1.1 /x/vitest/examples/profiling

  vite-node:server:request /x/vitest/examples/profiling/global-setup.ts +0ms
  vite-node:client:execute /x/vitest/examples/profiling/global-setup.ts +0ms
  vite-node:server:request /x/vitest/examples/profiling/test/prime-number.test.ts +45ms
  vite-node:client:execute /x/vitest/examples/profiling/test/prime-number.test.ts +26ms
  vite-node:server:request /src/prime-number.ts +9ms
  vite-node:client:execute /x/vitest/examples/profiling/src/prime-number.ts +9ms
  vite-node:server:request /src/unnecessary-file.ts +6ms
  vite-node:client:execute /x/vitest/examples/profiling/src/unnecessary-file.ts +4ms
...这种分析策略是识别由「 桶文件 / barrel files 」引起的不必要转换的好方法。如果这些日志包含了在运行测试时不应该加载的文件,你可能有桶文件在不必要地导入文件。
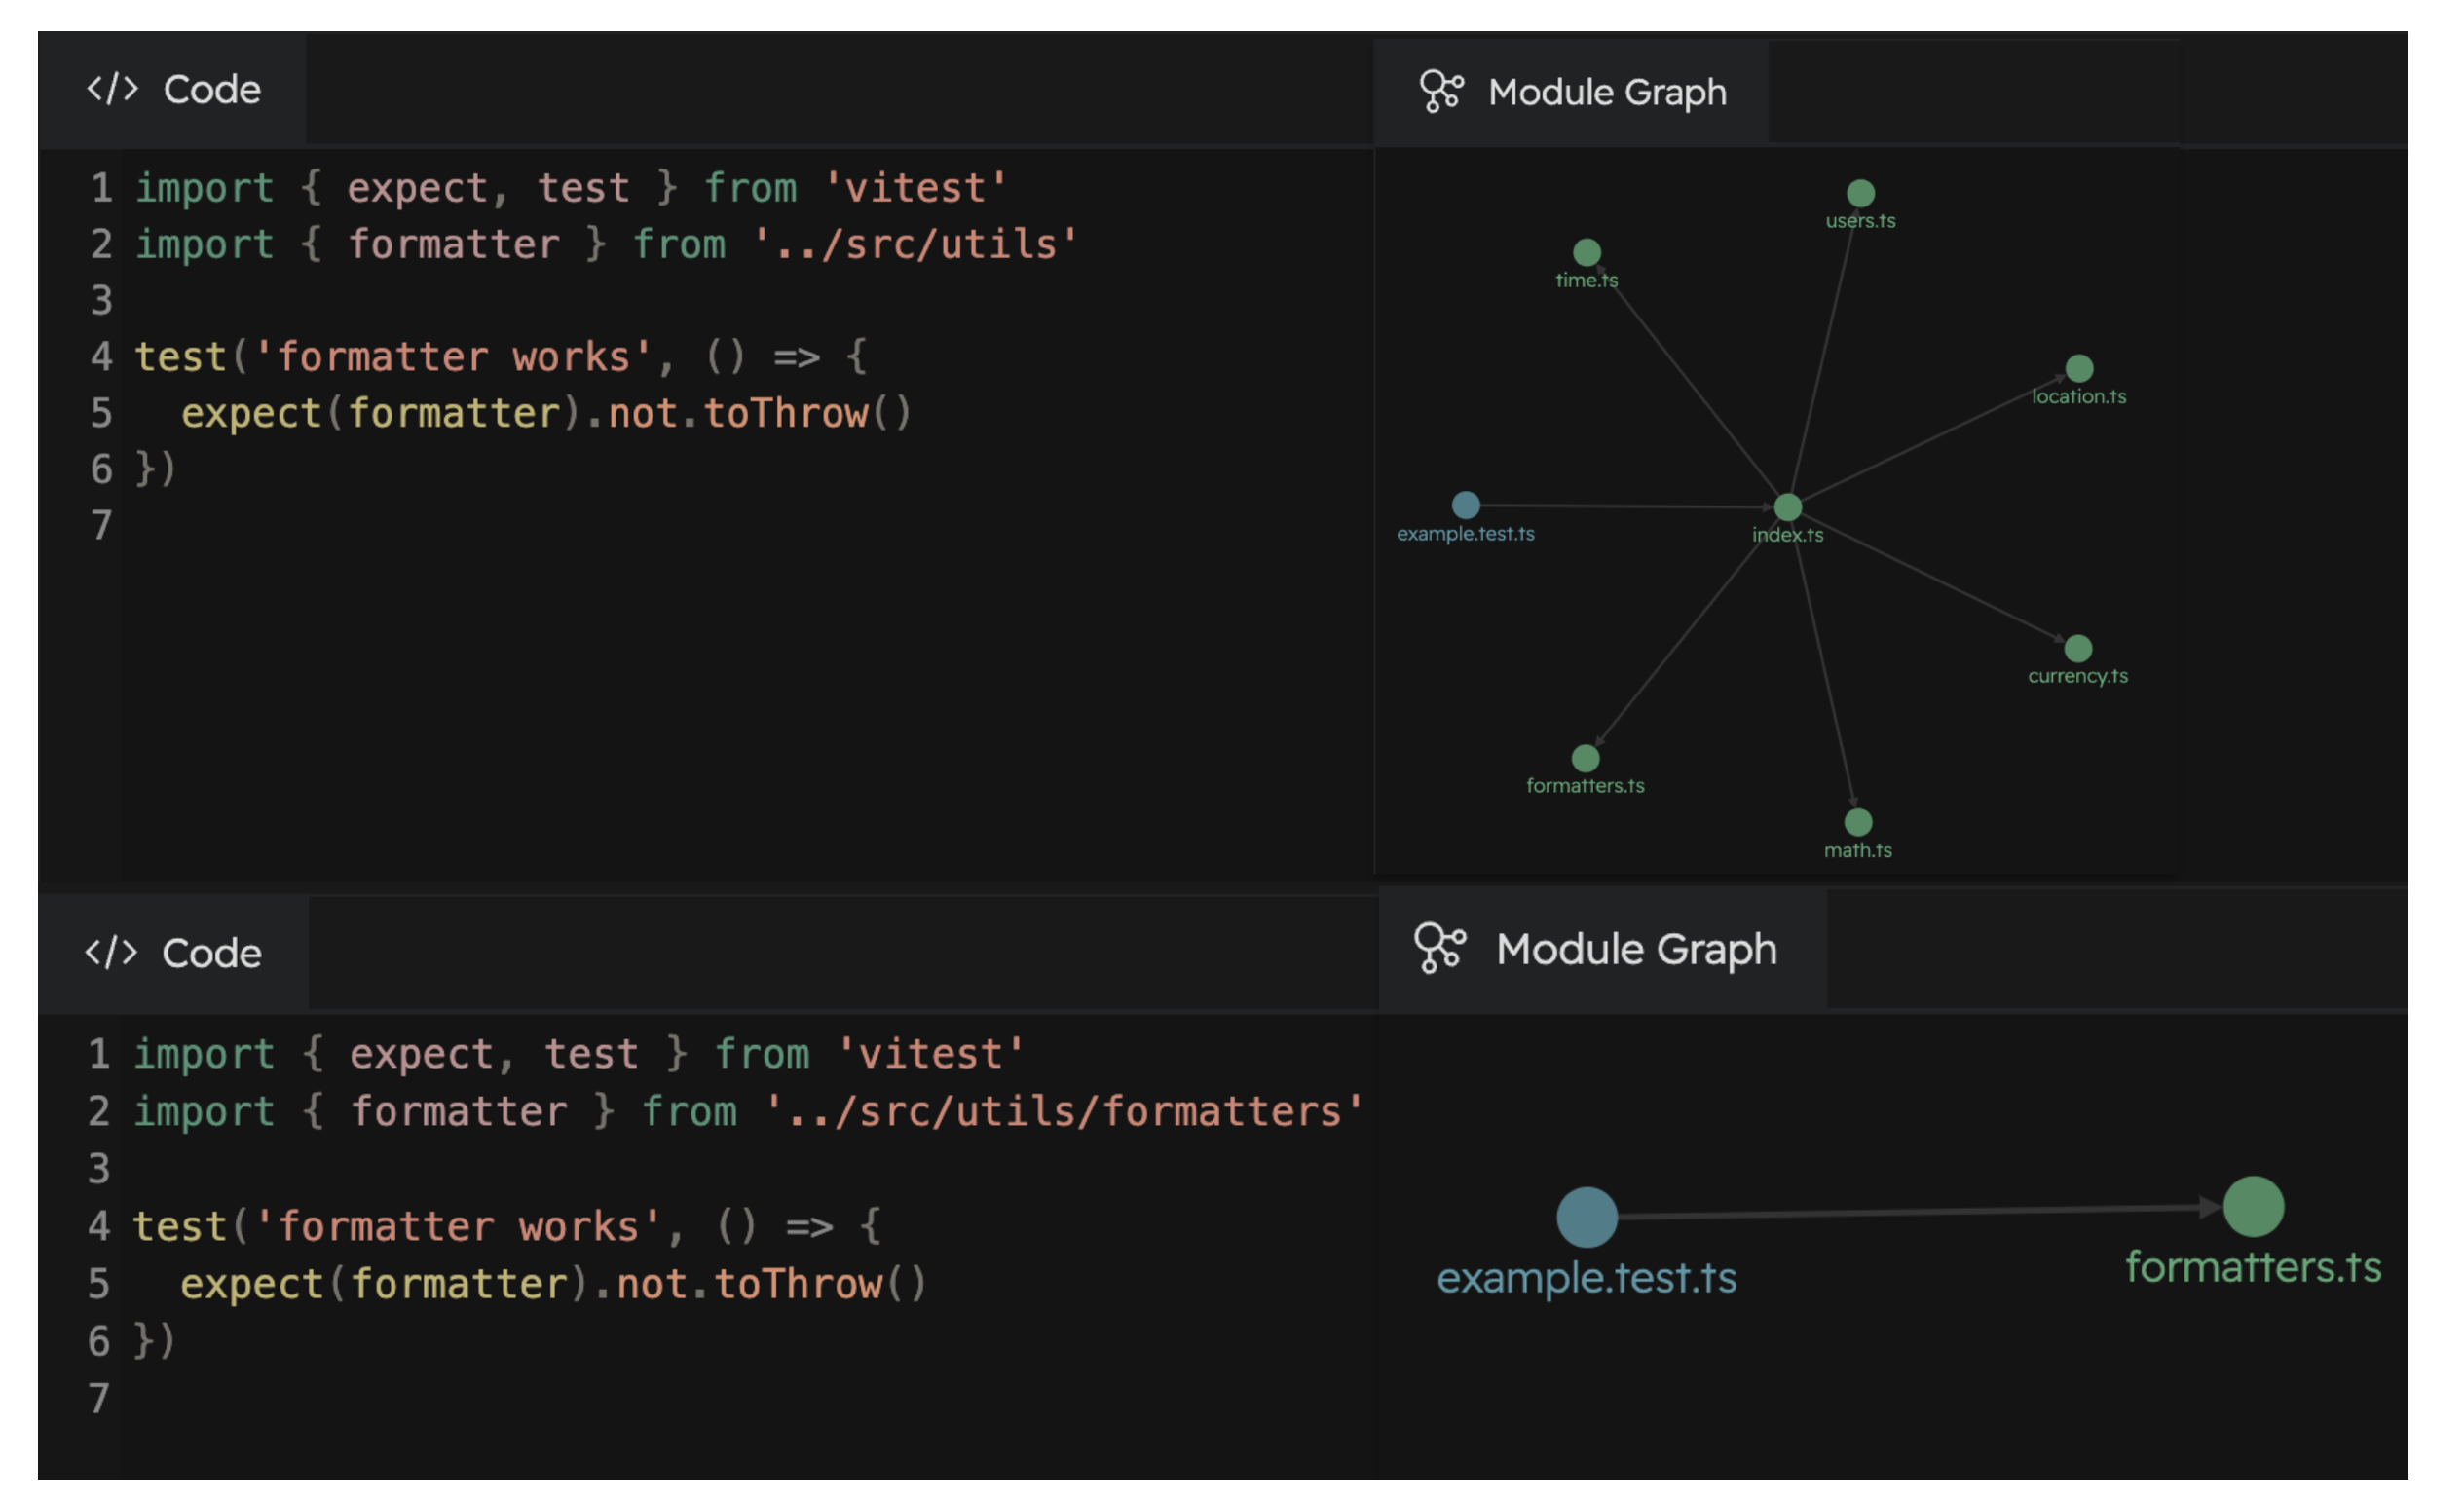
也可以使用 Vitest UI 来调试由打包文件引起的缓慢问题。 下面的例子展示了不使用打包文件导入文件可以减少约85%的转换文件数量。
├── src
│   └── utils
│       ├── currency.ts
│       ├── formatters.ts  <-- File to test
│       ├── index.ts
│       ├── location.ts
│       ├── math.ts
│       ├── time.ts
│       └── users.ts
├── test
│   └── formatters.test.ts
└── vitest.config.tsimport { expect, test } from 'vitest'
import { formatter } from '../src/utils'
import { formatter } from '../src/utils/formatters'
test('formatter works', () => {
expect(formatter).not.toThrow()
})
要查看文件是如何转换的,可以使用 VITE_NODE_DEBUG_DUMP 环境变量将转换后的文件写入文件系统:
$ VITE_NODE_DEBUG_DUMP=true vitest --run

[vite-node] [debug] dump modules to /x/examples/profiling/.vite-node/dump

 RUN  v2.1.1 /x/vitest/examples/profiling
...

$ ls .vite-node/dump/
_x_examples_profiling_global-setup_ts-1292904907.js
_x_examples_profiling_test_prime-number_test_ts-1413378098.js
_src_prime-number_ts-525172412.js
Code coverage
如果你的项目中代码覆盖率生成较慢,您可以使用 DEBUG=vitest:coverage 环境变量来启用性能日志记录。
$ DEBUG=vitest:coverage vitest --run --coverage

 RUN  v3.1.1 /x/vitest-example

  vitest:coverage Reading coverage results 2/2
  vitest:coverage Converting 1/2
  vitest:coverage 4 ms /x/src/multiply.ts
  vitest:coverage Converting 2/2
  vitest:coverage 552 ms /x/src/add.ts
  vitest:coverage Uncovered files 1/2
  vitest:coverage File "/x/src/large-file.ts" is taking longer than 3s
  vitest:coverage 3027 ms /x/src/large-file.ts
  vitest:coverage Uncovered files 2/2
  vitest:coverage 4 ms /x/src/untested-file.ts
  vitest:coverage Generate coverage total time 3521 ms
这种性能分析方法非常适合检测被覆盖率提供程序意外包含的大文件。 例如,如果你的配置意外地将大型构建压缩后的 JavaScript 文件包含在代码覆盖率中,这些文件应该会出现在日志中。 在这种情况下,你可能需要调整 coverage.include 和 coverage.exclude 选项。
Inspecting profiling records
可以使用各种工具检查 *.cpuprofile 和 *.heapprofile 的内容。下面是一些示例。